Does USD/IDR Predict IHSG Returns?
Time series analysis at glance.
Why I even started this
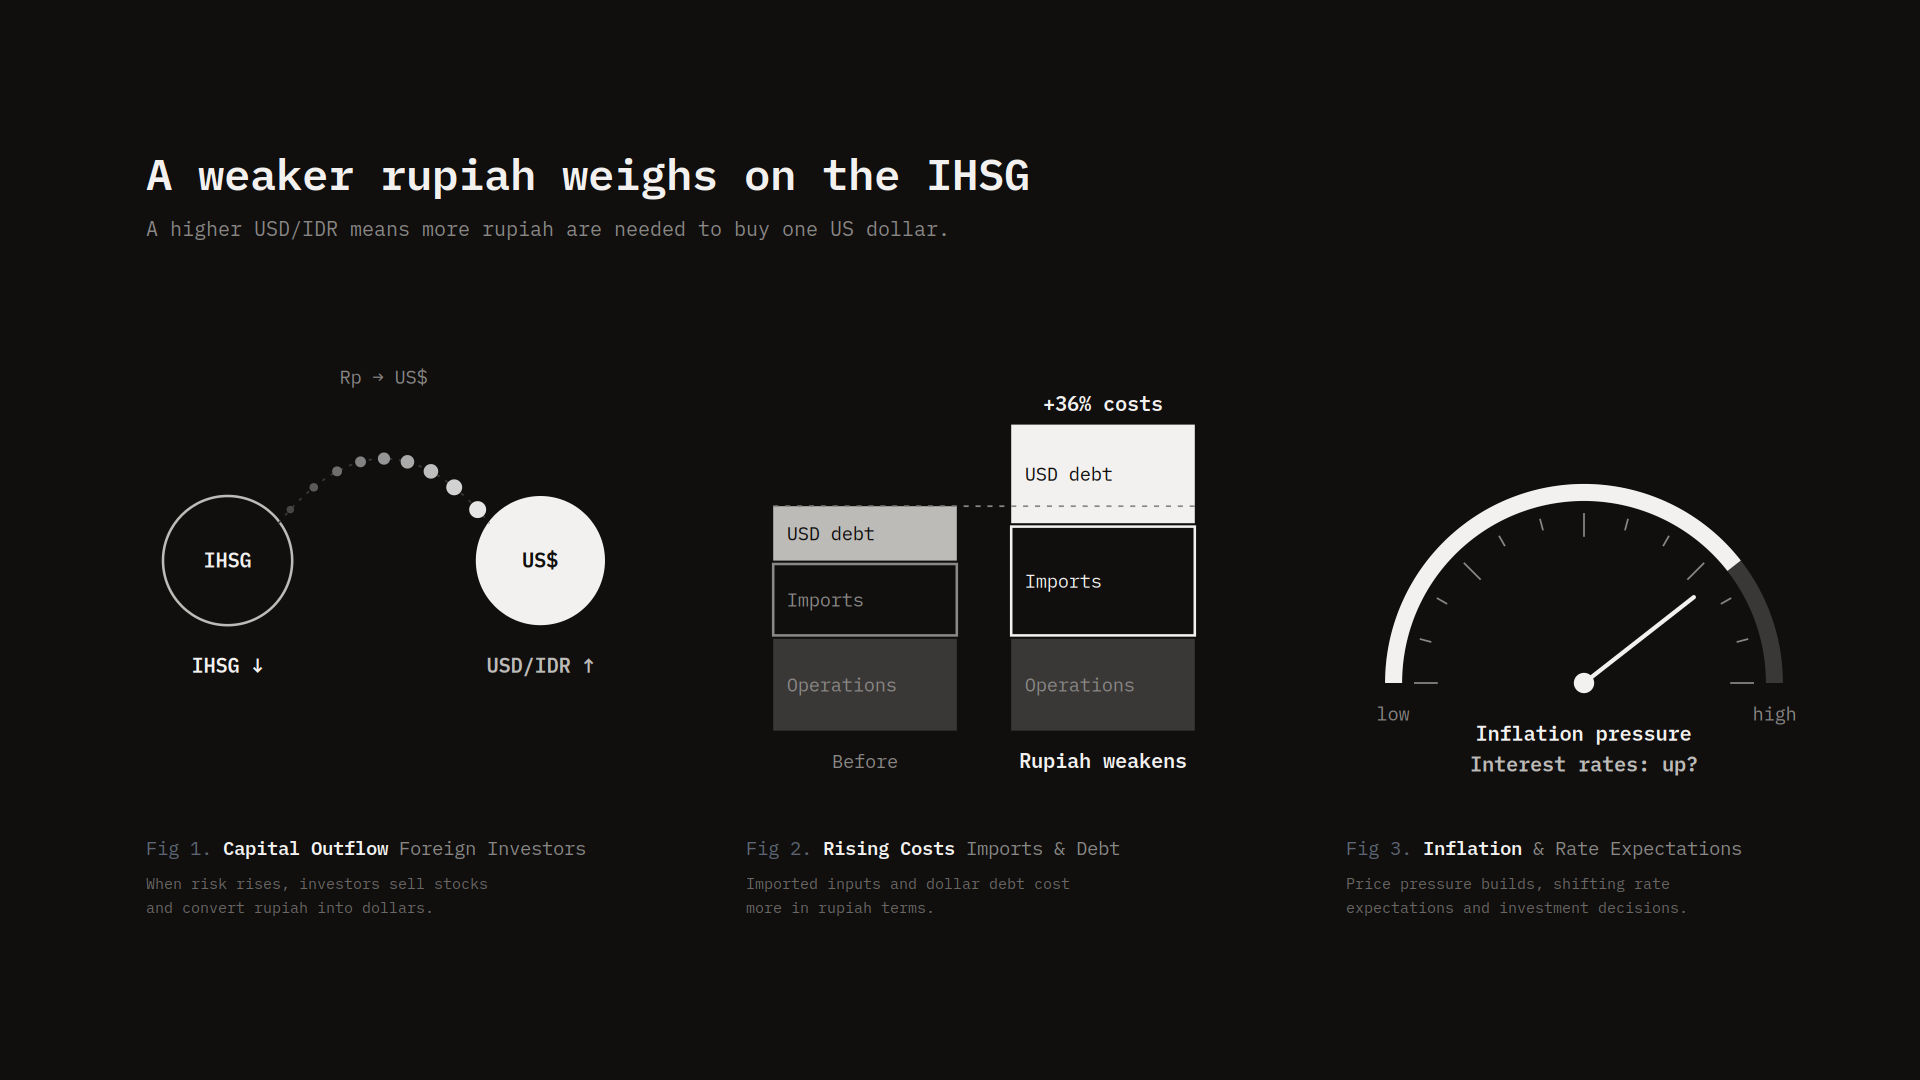
So I’ve been curious about something for a while. In Indonesia, whenever the rupiah gets weak against the US dollar, everyone panics. My parents talk about it. The news talks about it. “Dollar naik, market turun,” they say. As if it’s a law of physics or something.
At my first glance, this is thought what i initiated this project. If rupiah weaker through time, will it be burden on a corporate for instance who supply their raw materials and suddenly increase import cost? (rising dollar debt cost in rupiah). Of course it’s not only cause and that stand by its only own, it one of metrics but how strong the causality?.
So I pulled together daily closing prices for two things:
- IHSG (that’s the Jakarta Composite Index, basically how the Indonesian stock market is doing, ticker
^JKSE) - USD/IDR (how many rupiah you need to buy one US dollar)
And I ran the numbers from January 2019 all the way to September 2026. That’s about 1,865 trading days. A pretty decent chunk of history, it covers the pandemic crash, the recovery, the rate hikes, all of it.
I know “econometric analysis” sounds scary. I tried to keep the math hidden and just talk about what it means. That’s the point of this post.
First, a picture of the two lines
Before any statistics, I just plotted the two series so I could actually see what I’m dealing with.
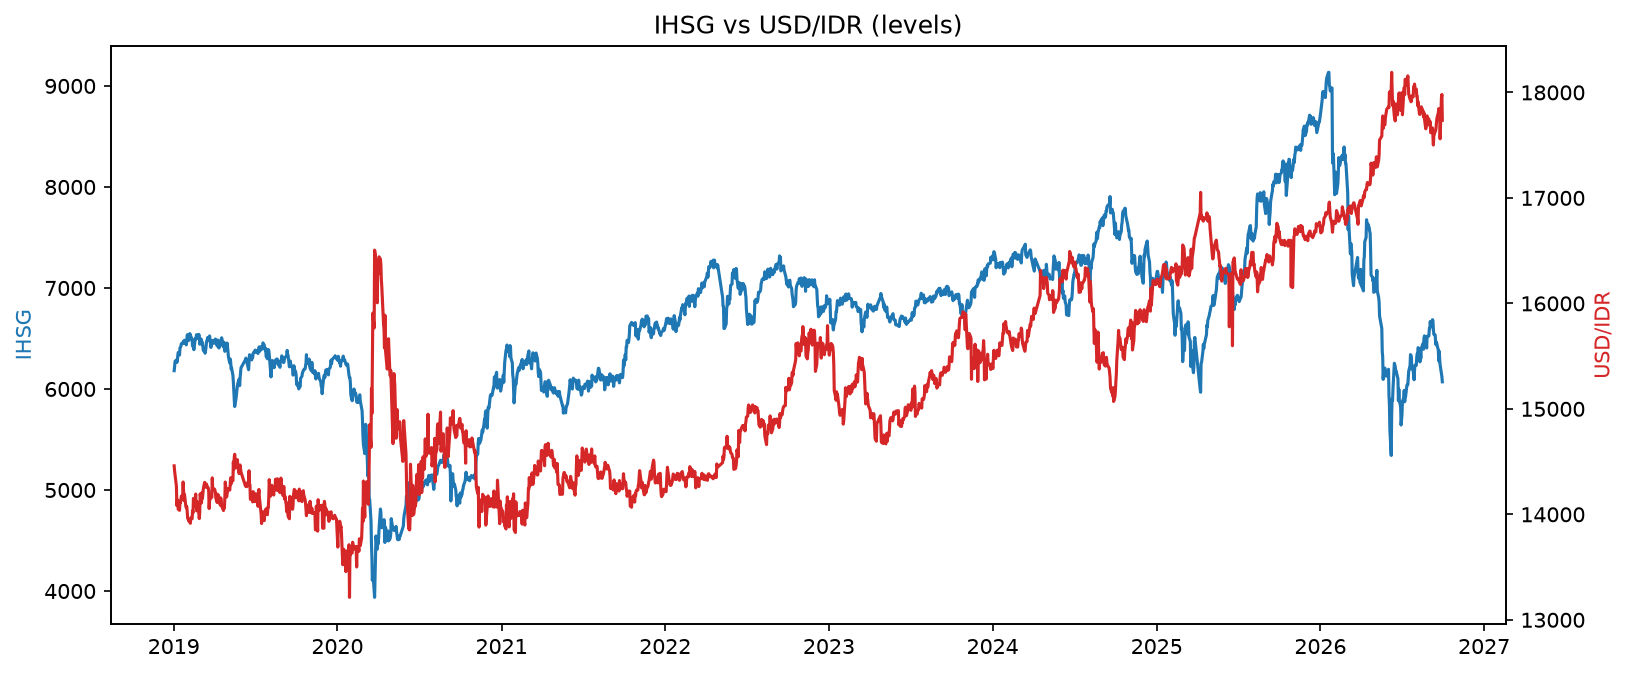
Honestly, this is the chart that started everything. You can see the IHSG tanking hard in early 2020 (hello, COVID) and USD/IDR spiking at exactly the same time. The rupiah weakened to almost 17,000 per dollar. Then both calm down.
But here’s the thing, eyeballing two lines that both move around a lot is dangerous. Just because they look related doesn’t mean they are. Both could be reacting to some third thing (like a global crisis). This is exactly why you need actual statistics instead of just squinting at a chart.
Also worth noting: over long stretches, both series trend. The IHSG generally drifts up, USD/IDR generally drifts up too. If you’re careless, you can “find” a relationship between two trending things that’s completely fake. Statisticians call this a spurious regression. So step one is dealing with that.
Step 1: Don’t be fooled by trends (the boring but important part)
To avoid the fake-relationship trap, I did two things:
- Ran an ADF test to check whether each series is “stationary”, meaning it doesn’t just wander off with a trend.
- Converted prices into daily returns (percentage changes) instead of levels.
Here’s what came out:
| Series | Stationary? |
|---|---|
| IHSG (price level) | ❌ No, it trends |
| USD/IDR (price level) | ⚠️ Sort of |
| IHSG daily return | ✅ Yes |
| USD/IDR daily return | ✅ Yes |
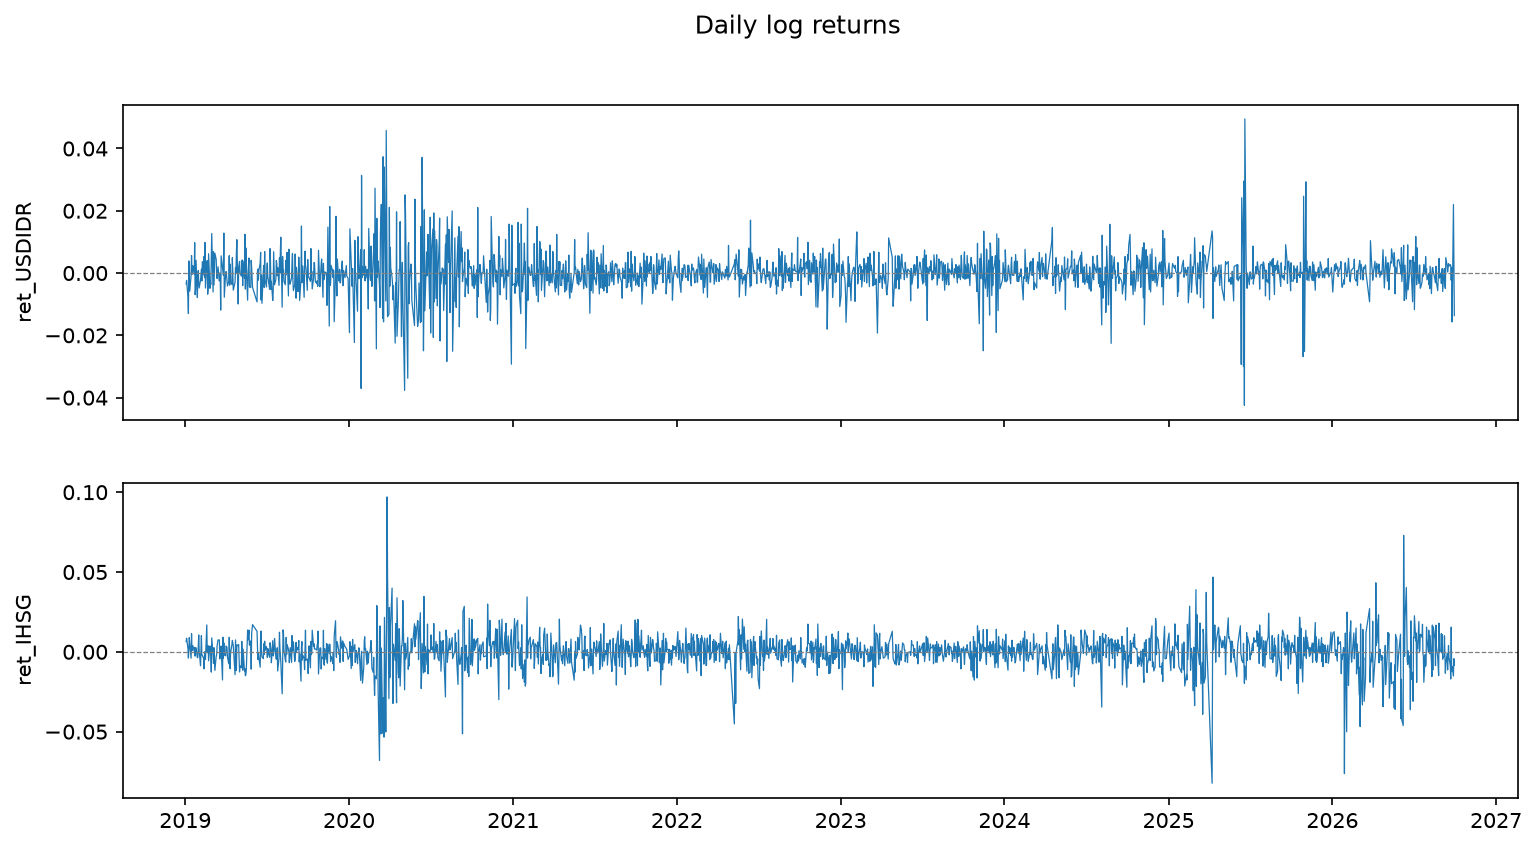
This matters a lot. Working with returns instead of prices is the difference between real analysis and nonsense. Once I’m looking at daily percentage moves, the trend problem goes away.
I also looked at whether up-days and down-days look different:
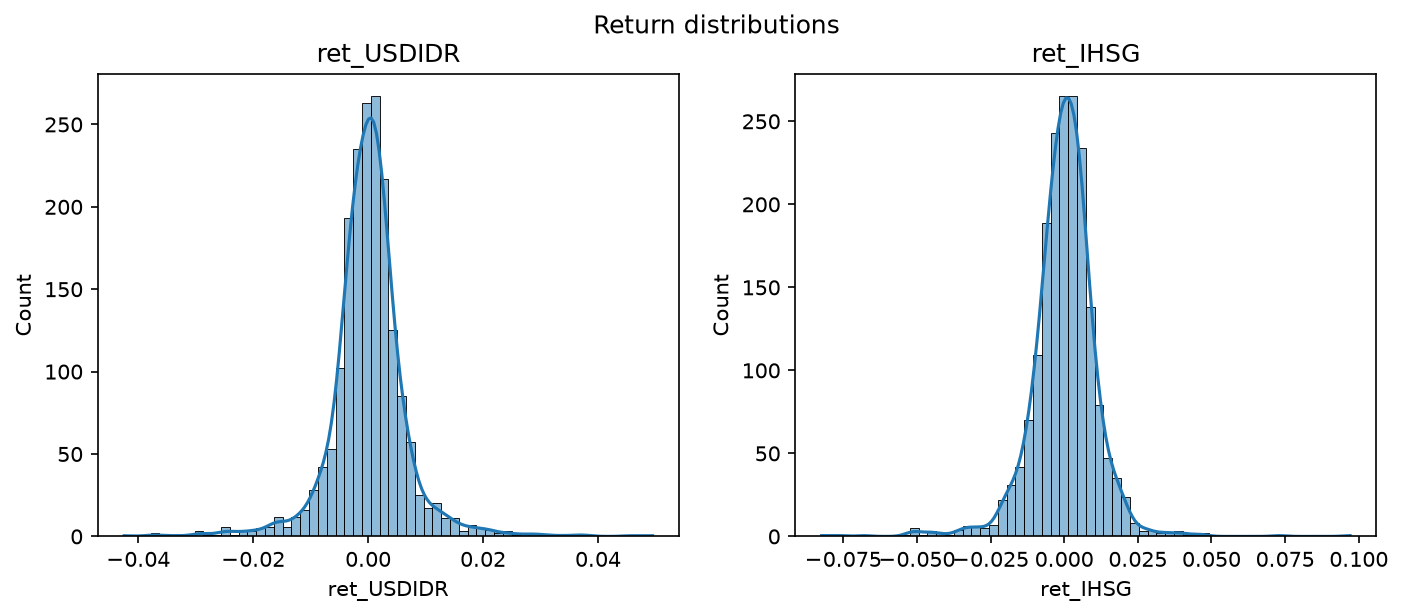
Two things jump out. First, both distributions have really fat tails, meaning extreme days happen way more often than a “normal” bell curve would predict. Second, IHSG has a slight tendency for bigger down moves. Classic stock market behavior. Good to know, because it tells me not to trust ordinary statistics naively.
Step 2: Do they move together on the same day?
Now the fun part. I just asked: on a given day, if the rupiah weakens, is the stock market up or down?
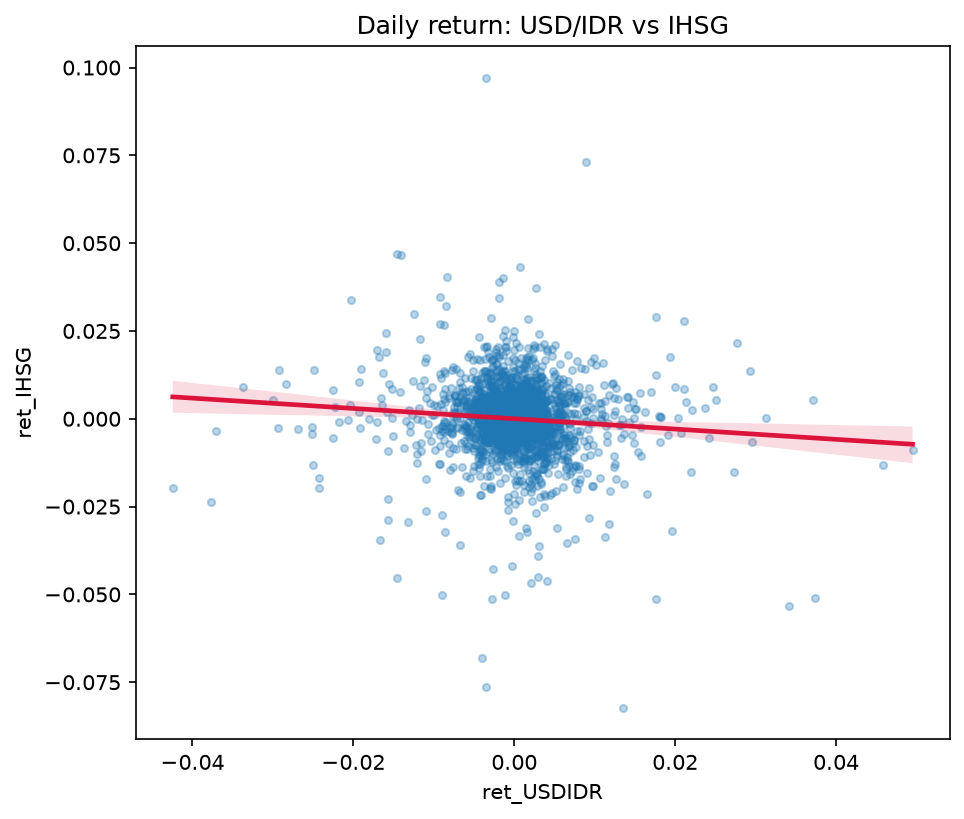
The scatter plot shows a mild negative tilt. When USD/IDR goes up (rupiah weaker), IHSG tends to go down. But it’s noisy, the cloud is really spread out. No single day tells you much.
The regression result:
β = −0.133 (statistically significant, p = 0.049)
Translation: a 1% move in USD/IDR is associated with about a −0.13% move in IHSG on the same day. So if the rupiah weakens by 1%, the index tends to drop a little over a tenth of a percent. Real, but small.
And yes, this matches the intuition everyone has. Weaker rupiah → foreign investors pull money out → market falls. Nice when the data confirms the story everyone tells.
But wait - the R² is only 0.008. That means FX explains less than 1% of the day-to-day movement in the index. Which makes total sense, honestly. The stock market is driven by so many thing: earnings, global sentiment, interest rates, politics. A single currency pair being responsible for 1% of it is… normal. I had to remind myself of that so I didn’t feel disappointed.
Step 3: But what about delays?
Here’s where it gets genuinely interesting, and where I almost made a mistake.
Indonesia’s stock exchange closes around 4pm WIB. But USD/IDR basically trades 24 hours. So if the rupiah does something dramatic overnight, that move might not show up in the index until the next day’s close. The “same-day” number might be missing half the story.
So I added lagged FX returns - today’s FX move, yesterday’s, the day before, all the way out to 5 days back. The question becomes: does FX today affect the market over the next week, not just today?
The answer surprised me:
Total effect over 6 days: −0.303, but not statistically significant (p = 0.322).
So the cumulative effect is bigger than the same day effect (0.30 vs 0.13), which fits the delay idea, information trickles in. But it’s not precise enough to call it real. The error bars are huge.
There is a joint test though, and:
Joint F-test: F = 2.21 (p = 0.039)
This says: taken together, the FX coefficients do carry some information. So the daily effect is real, but it doesn’t cleanly accumulate into a strong week-long trend I can pin down with confidence.
This little section is honestly my favorite part, because it captures what research actually feels like: you get a result, you get suspicious of it, you dig deeper, and the answer becomes “yes, but also not really, and now I understand why.”
Step 4: Which way does the arrow point? (The plot twist)
Everything so far assumed: FX moves → market moves. Rupiah weakens → IHSG falls.
But what if it’s the other way around? Or both?
I ran a Granger causality test, which basically asks: does knowing one variable’s past help predict the other one’s future, beyond just using its own past?
The results are, and I’m not exaggerating, the most interesting thing in the whole project:
| Direction | Result |
|---|---|
| FX → IHSG | ❌ Not significant (at any lag) |
| IHSG → FX | ✅ Hugely significant (all lags) |
Read that again. The stock market predicts the exchange rate. The exchange rate does NOT predict the stock market.
That completely flips the story. It’s not “rupiah weakens, then the market falls.” It’s more like: something happens that moves the stock market first, and the currency follows along behind it.
What’s the “something”? Most likely foreign capital flows. When foreign investors buy or sell Indonesian stocks, they’re doing two transactions at once - buying/selling shares and converting currency. So both markets get hit by the same wave at roughly the same time. The stock market just happens to process the news a little faster.
Honestly this changed how I think about the whole “dollar naik, market turun” narrative. It’s not that the dollar pushes the market. They’re both being pushed by the same thing, and the market moves first.
Why I trust this (the checks I did)
I didn’t just run one regression and call it a day. A few things give me some confidence:
- I used robust standard errors (Newey-West). Day-to-day returns are autocorrelated and jumpy, so ordinary error bars lie. Mine don’t.
- The data is clean. I kept only days where both markets were open (the Indonesian exchange and the FX market have different holidays). No made-up numbers, no interpolation.
- I didn’t fish for results. I fixed the lag window (0–5 days) before running anything. If I’d tried 20 different lag setups and picked the prettiest p-value, I’d be fooling myself.
And to be honest about limits:
- Granger “causality” is not real causation. It’s about predictive order, not proof of a mechanism. It’s a strong hint, not a smoking gun.
- Residuals are not “normal.” The tests reject normality and constant variance - which was entirely expected, given those fat tails I showed you earlier. Robust errors handle it.
- R² is tiny (~1%). FX alone is a bad predictor of the market. But that was never the goal. I wanted to understand the relationship, not build a trading bot.
What I actually concluded
After all of this, here’s what I’d tell someone over coffee:
- Yes, there’s a same-day link - a weaker rupiah goes with a lower IHSG that day, and it’s statistically real. But it’s small.
- There’s a hint of a delayed effect that accumulates over a week, but it’s too noisy to be confident about.
- The causality runs the “wrong” way - the stock market leads the exchange rate, not the other way around. This is the headline finding for me.
- Both markets are mostly dancing to the same external music - foreign flows, global risk, the Fed - rather than one causing the other.
The boring version of the takeaway: “dollar naik, market turun” is a correlation, not a cause. They move together because something else is moving both. And on a day-to-day basis, the market blinks first.
Everything here is reproducible - the code, the data, and all the numbers live in the project. full project on my Github